
HbA1c Evidence for a Prediabetes Diagnosis Delays Onset of Type 2 Diabetes
Maurice C. Johnson, Jr.1, Howard A. Fishbein1*, Rebecca Jeffries Birch1, Qilu Yu2, Russ Mardon1, Wilson Pace3, Natalie Ritchie4, Jennifer K. Carroll5, Daniella Meeker6
1Westat, Rockville, MD, USA
2National Center for Complementary and Integrative Health (NCCIH), National Institutes of Health (NIH), Bethesda, MD, USA
3DARTNet, Aurora, CO, USA
4University of Colorado/Denver Health and Hospitals Authority, USA
5University of Colorado, USA
6University of Southern California, USA
Abstract
Objective: This study examined the influential role of making a prediabetes diagnosis resulting in the subsequent delay in onset of type 2 diabetes.
Research Design and Methods: Using electronic medical records, a multivariable logistic regression model examined demographic and clinical risk factors associated with a prediabetes diagnosis among patients with HbA1c evidence of prediabetes. A multivariable non-proportional Cox regression examined development to type 2 diabetes (maximum 7 year follow-up).
Results: Analysis includes 40,970 patients with incident prediabetes (76.8% undiagnosed). Logistic regression showed higher baseline HbA1c levels significantly influenced assigning a prediabetes diagnosis: compared to patients with HbA1c level 5.7-5.9% (low), OR 1.66 (99% CI 1.54-1.78) for HbA1c level 6.0-6.2% (medium) and OR 1.62 (CI 1.43-1.83) for HbA1c level 6.3-6.4% (high). Cox model results, which included an interaction between HbA1c and prediabetes diagnosis, found HbA1c the most significant predictor. Patients with diagnosed prediabetes progressed to type 2 diabetes slower than those undiagnosed. Comparing diagnosed patients to undiagnosed within the same HbA1c level, HRs ranged from 0.47 (CI 0.37-0.61) in the high HbA1c level to 0.83 (CI 0.67-1.02) in the low HbA1c level.
Conclusions: From the LEADR cohort (1) HbA1c levels were the principle factor associated with risk for prediabetes diagnosis. Modeling development to diabetes, baseline HbA1c was the significant predictor of risk. Findings suggest assignment of a prediabetes diagnosis is associated with slower development of diabetes and this protective benefit of being diagnosed increases with a higher baseline HbA1c. Prediabetes diagnosis is useful for delaying onset of type 2 diabetes.
Introduction
Diabetes mellitus affects 30.3 million individuals in the US1and is the seventh leading cause of death2, accounting for an estimated economic cost of $327 billion in 20173. In adults, the majority of diabetes cases are type 2 diabetes. Prediabetes, also referred to as intermediate hyperglycemia, signifies an increased risk of developing type 2 diabetes4,5,6. Nearly 84.1 million US adults, or roughly one third of US adults, are estimated to have prediabetes1.
Diagnosing prediabetes may be an important initial step toward actions to slow or prevent diabetes onset. Research shows that lifestyle interventions, including physical activity, healthy diet, and treatment with drugs (e.g., metformin), can delay or prevent progression from prediabetes to diabetes7,8. The American Diabetes Association encourages health care providers to screen for prediabetes, followed by referring to diabetes prevention programs and prescribing metformin therapy9. Nonetheless, adoption of prediabetes screening tools and referrals to lifestyle interventions are relatively low11, as is use of metformin therapy10. Studies of electronic health records (EHRs) further show relatively few recorded prediabetes diagnoses in patients with glycemic evidence of the condition, and highlight knowledge gaps regarding the impact of diagnosis on progression to diabetes11,12,13. The debated utility of diagnostic protocols for prediabetes14-20 may underlie low rates of screening, diagnosis, and treatment, and therefore further study is needed to understand patterns in prediabetes diagnosis and what association exists between receiving a diagnosis and progression to diabetes.
To understand factors that influence diagnosis of prediabetes, this study uses the published large-scale database of EHR records21 to assess the demographic and clinical differences between diagnosed and undiagnosed patients with evidence of prediabetes based on glycosylated hemoglobin (HbA1c) results. The study further investigates differences in risk of progression to diabetes between diagnosed and undiagnosed prediabetes patients.
Research Design and Methods
Study Design and Population
This retrospective observational study uses the Longitudinal Epidemiologic Assessment of Diabetes Risk (LEADR) database21, which is an aggregated EHR-derived database for examining patient-level risk factors for diabetes among adults. The EHR data comes from participating healthcare organizations including primary care and multi-specialty integrated delivery systems with ambulatory and inpatient components located across the U.S and aggregated into four regions: Northeast (Connecticut, Vermont, and Ohio), South (North Carolina and Tennessee), Rocky (Wyoming, Nebraska, and Colorado), and West (California, Idaho, and Washington).
Patients in the LEADR database had at least four encounters within a participating healthcare network between January 1, 2010, and December 31, 2018, each at least 14 days apart and with at least 24 months between the first and last encounters. An encounter is defined as the unique date on which one or more conditions, observations, procedures, drugs, or visits are recorded within a healthcare network’s EHR system. Patients with type 1 diabetes, type 2 diabetes, gestational diabetes, or unspecified diabetes prior to or during their first 12 months after initial identification were excluded from LEADR such that those remaining with subsequent evidence of diabetes were considered incident diabetes cases. The resulting cohort had over 2 million patients with geographic region serving as the only attributable provider characteristic. Standardization of EHR records across the participating LEADR healthcare networks was accomplished with the Observational Medical Outcomes Partnership Common Data Model (OMOP)22.
A series of steps were conducted to derive an analytic population that 1) limited analysis to incident cases of prediabetes, 2) ensured all patients had glycemic evidence of prediabetes, 3) ensured all patients had shared clinical and demographic data available (complete case analysis), and 4) contained the same population for both the logistic and cox regression analyses. To accomplish these goals, the study focused on patients newly found to have prediabetes, defined as a HbA1c value in the prediabetes range (5.7-6.4%) following a 12 month washout period with no evidence of the condition. We selected HbA1c as the only glucose-related value to identify patients with prediabetes as only a small percentage (< 5%) of the glucose measures in LEADR had a corresponding fasting indicator. Hence, most blood sugar values were considered random glucoses, which are not standard observations used for diagnosing diabetes9. Each patient’s first HbA1c record in prediabetes range served as the baseline date.
Patients with at least one prediabetes diagnosis code were considered cases of diagnosed prediabetes (DxP), and those without a diagnosis code were defined as cases of undiagnosed prediabetes (UDxP). Determination of a prediabetes diagnosis used OMOP codes related to the International Classification of Diseases, 9th (ICD-9) and 10th (ICD-10) edition codes 790.2X and R73.03.
The study population was further limited to patients with at least one of each of the following: 1) HbA1c result, 2) BMI, 3) blood pressure results (i.e., systolic and diastolic values, or diagnosis or medication related to treatment of hypertension), and 4) lipid results (i.e., triglyceride, HDL, or non-HDL values, or diagnosis or medication related to treatment of elevated lipids). This restriction helped ensure patient-level information was similar across health care systems and facilitated the assumption that clinicians had comparable information when assessing patients’ risk of prediabetes and diabetes.
Additional patients were excluded if missing demographic information (i.e., age, sex, or race/ethnicity), or they were pregnant or had gestational diabetes during the study period. Figure 1 outlines how the analytic population was derived from the LEADR cohort. Supplemental Table 1 provides a summary of the reasoning for each of the steps in developing the analytic population for this study.

Figure 1: Development of the Incident Prediabetes Analytic Population from the Original LEADR Cohort
Table S1: Deriving the study population (new cases of prediabetes) from the LEADR Cohort
|
Exclusion Criteria |
Reasoning for Exclusion |
Number of patients |
|
1. Original LEADR cohort |
|
2,087,742 |
|
2. No demographics |
Ensure all patients age, sex, and race/ethnicity for analysis |
98,352 |
|
3. No HbA1c in prediabetes range |
Analysis is focused on patients with prediabetes |
1,774,293 |
|
4. Record of gestational diabetes |
Remove potential labs prediabetes range indicating gestational diabetes |
3,122 |
|
5. Record of pregnancy during prediabetes period |
Remove potential labs in prediabetes range indicating gestational diabetes |
6,727 |
|
6. Record of prediabetes within first 365 days in cohort |
Analysis is focused on incident cases of prediabetes |
55,328 |
|
7. Prediabetes DX more than 30 days prior to hba1c in prediabetes range |
Incident cases of prediabetes defined by HbA1c lab |
41,603 |
|
8. Record of diabetes before earliest prediabetes record |
Remove potential labs in prediabetes range indicating diabetes control |
19,382 |
|
9. HbA1c in prediabetes range lab is last encounter |
Ensure outcome re for survival analysis is record of diabetes |
5,353 |
|
10. Record of prediabetes diagnosis after diabetes |
Ensure outcome for survival analysis is record of diabetes |
3,160 |
|
11. Prediabetes Analytic Population |
|
87,747 |
|
12. No BMI, blood pressure, or elevated lipid record |
Ensure all patients had all covariates for complete case analysis. |
46,777 |
|
13. Prediabetes Analytic Population (Has HbA1c, BMI, blood pressure, and elevated lipid record) |
|
40,970 |
New cases of type 2 diabetes were identified from diagnosis records, anti-diabetic drug prescriptions, HbA1c, fasting plasma glucose, and random glucose values. Supplemental Table 2 provides detailed definitions of the study’s demographic and clinical variables of interest.
Table S2: Case definitions of Selected Variables in the LEADR Cohort
|
Variable |
Definition |
|
Diagnosed prediabetes (DxP) |
Prediabetes diagnosis following earliest record of HbA1c lab result in prediabetes range (≥ 5.7% and <6.5%). OMOPS for a prediabetes diagnosis derive from: |
|
a) ICD-9-CM and ICD-10 classifications for abnormal glucose tolerance test OR |
|
|
b) ICD-9-CM and ICD-10 classifications for impaired fasting glucose |
|
|
Undiagnosed prediabetes (UDxP)
|
Prediabetes HbA1c lab result (≥ 5.7% and <6.5%) AND No prediabetes diagnosis AND no previous indication of diabetes (diagnosis or lab result in diabetes range) |
|
Onset of type 2 diabetes
|
At least 30 days following baseline date, any of the following: 1. A diabetes diagnosis of type 2 diabetes or unspecified diabetes diagnosis made on two different days within 24 months (diagnosis dates ≥ 14 days apart) OR |
|
2. A prescription for metformin or glucagon-like peptide-1 (GLP1) agonists and a Type 2 or unspecified diabetes diagnosis on any encounter (activities < 14 days apart). OR |
|
|
3. A prescription for an antidiabetic agent |
|
|
a) alpha-glucosidase inhibitors, |
|
|
b) amylin analogs, |
|
|
c) anti-diabetic agent combinations including those with metformin; |
|
|
d) insulin among non-pregnant women, |
|
|
e) meglitinides, |
|
|
f) sodium glucose cotransporter 2 (SGLT2) inhibitors, |
|
|
g) sulfonylureas, |
|
|
h) thiazolidinediones, and/or |
|
|
i) Dipeptidyl peptidase-4 (DDP-4) inhibitor; OR |
|
|
4. Lab results in diabetes range |
|
|
a) hemoglobin A1c lab result ≥ 6.5% or |
|
|
b) fasting plasma glucose > 126 mg/dl, or |
|
|
c) random glucose ≥250 mg/dl Patients that did not meet any of the criteria noted above were classified as no record of onset diabetes. |
|
|
HbA1c level |
Baseline HbA1c levels: Low 5.7% ≤ HbA1c < 6.0%, Medium 6.0% ≤ HbA1c < 6.3% High 6.3% ≤ HbA1c < 6.5% |
|
Race/Ethnicity |
Hispanic |
|
Non-Hispanic black |
|
|
Non-Hispanic white |
|
|
Asian/American Indian/Alaska Native/Other/multiple races |
|
|
Age |
Age of patient at study baseline. 18 to 39 years |
|
40 to 64 years |
|
|
65 years and older |
|
|
Region |
LEADR defined regions of participating providers Northeast (Connecticut, Vermont, Ohio) |
|
West (California, Idaho, Washington) Rocky (Wyoming, Nebraska, and Colorado) South (North Carolina and Tennessee) |
|
|
Number of encounters |
Number of contacts with healthcare organization throughout time in the cohort, each at least 14 days apart. Contacts include a diagnosis record, prescription, procedure, or lab result. Number of encounters is difference between earliest record of prediabetes in EHR and last visit recorded in EHR or date of type II diabetes.
Prior to baseline study period are number of encounters prior to 1st HbA1c lab result in prediabetes range.
After baseline are number of encounters on the day of and after the 1st Hba1c lab result in prediabetes range up to the last encounter in the in dataset or day of type 2 diabetes, whichever comes first. |
|
BMI weight categories |
BMI nearest baseline date. Underweight, <18.5 kg/m2 |
|
Normal, 18.5 ≤ BMI < 25 kg/m2 |
|
|
Overweight, 25 ≤ BMI < 30 kg/m2 |
|
|
Obese I (OB1), 30 ≤ BMI < 35 kg/m2 |
|
|
Obese II (OB2), 35 ≤ BMI < 40 kg/m2 |
|
|
Obese III (OB3), ≥ 40 kg/m2 |
|
|
Hypertension/High Blood Pressure |
On day of or prior to baseline date. 1. Two hypertension diagnoses (≥ 14 days apart) nearest the earliest record of prediabetes |
|
2. A hypertension diagnosis and a hypertension medication prescription |
|
|
a) angiotensin-converting enzyme inhibitors (ACE), |
|
|
b) angiotensin II receptor blockers (ARB), |
|
|
c) beta blockers, |
|
|
d) calcium channel blocks, and/or |
|
|
e) diuretics |
|
|
3. A hypertension diagnosis and |
|
|
a) systolic blood pressure average ≥ 140 mmHg (if at least two results ≥ 14 days apart), or |
|
|
b) diastolic blood pressure average ≥ 90 mmHg (if at least two results ≥ 14 days apart) |
|
|
Elevated Lipids |
On day of or prior to baseline date: 1. An elevated lipids diagnosis |
|
2. A prescription for elevated lipids medication |
|
|
a) statins or statin combinations |
|
|
b) fibrates |
|
|
c) niacin |
|
|
d) bile acid sequestrates, and/or |
|
|
e) other lipid-modifying agents |
|
|
3. Lab results nearest the earliest record of prediabetes |
|
|
a) triglyceride level ≥ 250 mg/dL |
|
|
b) HDL < 40 mg/dL for males and < 50 mg/dL for females. |
|
|
c) non-HDL value ≥ 160 mg/dL |
|
|
History of tobacco use |
On day of or prior to baseline date: 1) A diagnosis of: |
|
a) tobacco dependence syndrome, or |
|
|
b) tobacco abuse, or |
|
|
c) tobacco user, or |
|
|
d) personal history of tobacco use, or |
|
|
e) nicotine dependence, or |
|
|
2) Text denoting current tobacco user or quit smoking in Observation table, or |
|
|
3) Treatment for tobacco use in Procedure table, or |
|
|
4) A prescription for nicotine or varenicline Patients that did not meet any of these criteria noted above were classified as no record of tobacco use |
|
|
Metformin prescription |
A prescription for metformin on the baseline date or following date or following and prior to the first indication of diabetes, if any. Patients that did not meet any of these criteria noted above were classified as no record of metformin. |
Case definitions for dependent variable (prediabetes diagnosis), outcome variable (onset type 2 diabetes), and covariates. Definitions are applied the LEADR dataset using the Observational Medical Outcomes Partnership Common Data Model. For both the logistic regression and Cox non-proportional hazards, the baseline date is the first encounter when HbA1c level is in prediabetes range (≥ 5.7% and <6.5%)
Statistical Methods
Summary statistics among patient-level characteristics were examined by DxP and UDxP status. Differences between these groups were tested using a t-test for continuous variables and x2-test for categorical variables.
A multivariable logistic model with record of a prediabetes diagnosis code as the dependent variable was conducted, adjusting for age, sex, race/ethnicity, region, and the following baseline clinical characteristics: weight classification [normal/underweight (BMI <25 kg/m2), overweight (25 ≤ BMI < 30), obese I (30 ≤ BMI < 35), obese II (35 ≤ BMI < 40), and obese III (BMI ≥ 40)]; HbA1c level [low (5.7- 5.9%), medium (6.0-6.2%) high (6.3-6.4%)], elevated lipid status, hypertension status, history of tobacco use, and number of prior encounters. Odds ratios (OR) and 99% confidence intervals were calculated to compare DxP and UDxP populations.
The association between a prediabetes diagnosis and progression to type 2 diabetes was explored using a right-censored Cox regression model adjusting for age, sex, race/ethnicity, region, weight classification, HbA1c level, elevated lipid status, hypertension status, history of tobacco use, record of a metformin prescription, and number of encounters after baseline. Follow-up time for each patient was calculated from baseline to last recorded encounter date or earliest recorded date of diabetes, whichever came first. All possible interactions with prediabetes diagnosis status were investigated. The final adjusted model included an interaction term between HbA1c level and prediabetes diagnosis as it was the most significant interaction identified. An interaction term between prediabetes diagnosis and follow-up time was further added to the final model after examination of Kaplan-Meier curves and Schoenfeld plots indicated non-proportionality; as a result, hazard ratios (HR) and 99% confidence interval for prediabetes diagnosis are estimated assuming the median follow-up time of 634 days (1.7 years).
Analyses were performed using SAS 9.4, with a p-value of < 0.01 to determine statistical significance.
Results
Descriptive statistics of study population
The study population included 40,970 patients with a new case of prediabetes. Table 1 summarizes the demographic and clinical characteristics of the study population as well as the differences between the Dxp and UDxP groups. The UDxP group represented 76.8% of the study population. While 79.8% of patients with a low HbA1c level were undiagnosed, slightly over 70% of patients with medium and high HbA1c levels remained undiagnosed as well. With the exception of metformin prescriptions, the demographic and clinical characteristics between the DxP and UDxP groups differed significantly.
Table 1: Baseline demographic and clinical characteristics of the Diagnosed and Undiagnosed Prediabetes study populations
|
|
Total |
Diagnosed Prediabetes |
Undiagnosed Prediabetes |
|
|
Characteristics |
N (%) |
N (%) |
N (%) |
p-value |
|
Total Population of patients with prediabetes (row %) |
40,970 (100) |
9,490 (23.2) |
31,480 (76.8) |
<.0001 |
|
Total Population of patients with prediabetes (column %) |
40,970 (100) |
9,490 (100) |
31,480 (100) |
<.0001 |
|
Race/Ethnicity |
|
|
||
|
Hispanic |
10,387 (25.4) |
3,377 (35.6) |
7,010 (22.3) |
<.0001 |
|
Non-Hispanic Black |
4,560 (11.1) |
739 (7.8) |
3,821 (12.1) |
|
|
Non-Hispanic White |
23,955 (58.5) |
4,829 (50.9) |
19,126 (60.8) |
|
|
Asian/American Indian/Alaska Native/Other/multiple races |
2,068 (5.0) |
545 (5.7) |
1,523 (4.8) |
|
|
Age (baseline) |
|
|
||
|
18-39 |
7,108 (17.3) |
1,598 (16.8) |
5,510 (17.5) |
<.0001 |
|
40-64 |
25,227 (61.6) |
6,076 (64.0) |
19,151 (60.8) |
|
|
65 and older |
8,635 (21.1) |
1,816 (19.1) |
6,819 (21.7) |
|
|
Sex (Female) |
24,145 (58.9) |
5,844 (61.6) |
18,301 (58.1) |
<.0001 |
|
Region |
|
|
||
|
Northeast |
2,813 (6.9) |
900 (9.5) |
1,913 (6.1) |
<.0001 |
|
Rocky |
10,739 (26.2) |
2,752 (29.0) |
7,987 (25.4) |
|
|
South |
14,161 (34.6) |
1,547 (16.3) |
12,614 (40.1) |
|
|
West |
13,257 (32.4) |
4,291 (45.2) |
8,966 (28.5) |
|
|
Body Mass Index |
|
|
||
|
Underweight/Normal (<25 kg/m2) |
9,489 (23.2) |
1,987 (20.9) |
7,502 (23.8) |
<.0001 |
|
Overweight (25 ≤ BMI < 30) |
13,663 (33.3) |
3,239 (34.1) |
10,424 (33.1) |
|
|
Obese I (30 ≤ BMI < 35) |
9,565 (23.3) |
2,339 (24.6) |
7,226 (23.0) |
|
|
Obese II (35 ≤ BMI < 40) |
4,603 (11.2) |
1,116 (11.8) |
3,487 (11.1) |
|
|
Obese III (BMI ≥ 40) |
3,650 (8.9) |
809 (8.5) |
2,841 (9.0) |
|
|
HbA1c level |
|
|
||
|
5.7% to <6.0% |
28,001 (68.3) |
5,657 (59.6) |
22,344 (71.0) |
<.0001 |
|
6.0% to <6.3% |
10,323 (25.2) |
3,073 (32.4) |
7,250 (23.0) |
|
|
6.3% to <6.5% |
2,646 (6.5) |
760 (8.0) |
1,886 (6.0) |
|
|
Elevated Lipids (Yes) |
31,043 (75.8) |
7,575 (79.8) |
23,468 (74.5) |
<.0001 |
|
Hypertension (Yes) |
21,031 (51.3) |
5,329 (56.2) |
15,702 (49.9) |
<.0001 |
|
History of tobacco use (Yes) |
16,906 (41.3) |
3,378 (36.6) |
13,528 (43.0) |
<.0001 |
|
Metformin prescription (Yes) |
1,148 (2.8) |
284 (3.0) |
864 (2.7) |
0.20 |
|
Other Characteristics |
Total |
Diagnosed Prediabetes |
Undiagnosed Prediabetes |
p-value |
|
Average # of encounters prior to prediabetes (SD) |
24.3 (21.9) |
23.5 (19.9) |
24.5 (22.4) |
<.0001 |
|
Average # of encounters after prediabetes (SD) |
17.9 (17.9) |
24.7 (20.6) |
15.8 (16.4) |
<.0001 |
|
Average hemoglobin A1c (SD) |
5.89 (0.19) |
5.93 (0.19) |
5.88 (0.19) |
<.0001 |
|
Average follow-up time (SD) |
762 (571) |
1033 (604) |
680 (534) |
<.0001 |
Categorical variables are expressed as percentages. Continuous variables are expressed as mean ± SD. Number in parentheses indicate percentage of population from study population region, or SD for continuous measures.
Average HbA1c was 0.05% higher in the DxP versus the UDxP populations (5.93% versus 5.88%). There was a higher proportion of medium and high HbA1c levels in DxP versus UDxP populations (40.4% versus 29.0%). The average follow-up time was nearly one year longer in the DxP versus UDxP groups (1003 versus 680 days). Prior to the baseline prediabetes date for each patient, the DxP population had approximately one less encounter than the UDxP group (23.5 versus 24.5 encounters). After the baseline prediabetes date, the DxP population averaged nearly 9 more encounters than the UDxP group (24.7 versus 15.8 encounters). Larger proportions of the UDxP population had elevated lipids (79.8% versus 74.5%), and hypertension (56.2% versus 49.9%).
The DxP population had a lower proportion of non-Hispanic white and non-Hispanic black patients than the UDxP population (50.9% versus 60.8%, and 7.8% versus 12.1%, respectively); however, the DxP population had a larger Hispanic population (35.6% versus 22.3%). Patients in the 40-64 age group made up a majority of the study population, with that age group having slightly more representation in the DxP population (64.0% and 60.8%). The DxP population also had slightly more females compared to the UDxP group (61.6% versus 58.1%).
Multivariate analyses comparing diagnosed and undiagnosed prediabetes
Figure 2 presents the odds ratios (ORs) from the adjusted logistic regression. Supplemental Table 3 presents the adjusted parameter estimates, standard errors, and p-values from the adjusted logistic regression.
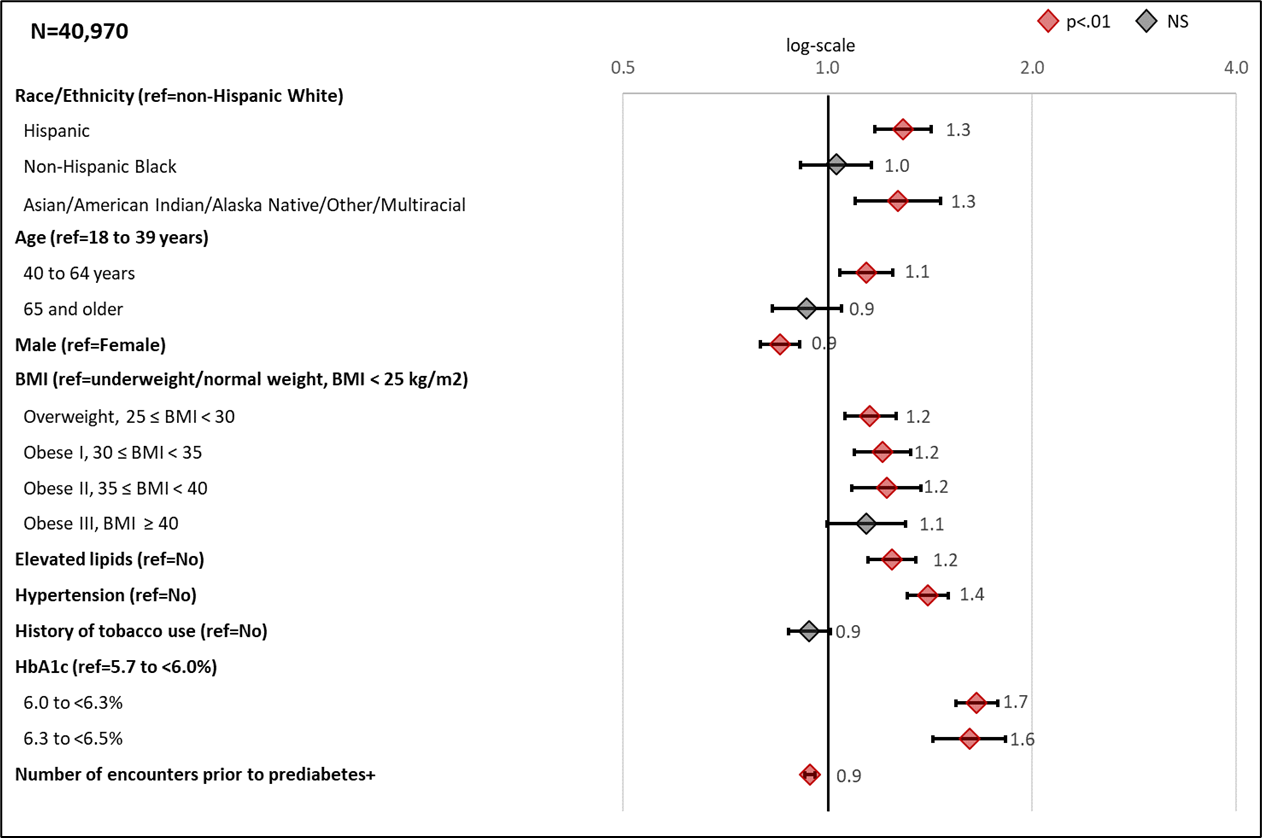
Figure 2: Adjusted odds ratios (99% CI) for Selected Characteristics Associated with Recording a Prediabetes Diagnosis
Forest plots showing the odds ratios for the association between risk factors and patient outcome of Diagnosed prediabetes from a multivariable logistic regression model. +Number of encounters reflect 10 unit increase. In addition to variables presented in forest plot, the model also adjusted for LEADR region.
Table S3: Multivariable logistic regression analysis for Diagnosed Prediabetes Patients
|
Parameter |
Estimate |
SE |
Wald Chi-Square |
p-value |
|
Race/Ethnicity (ref = non-Hispanic white) |
|
|||
|
Hispanic |
0.26 |
0.04 |
47.57 |
<.0001 |
|
Non-Hispanic black |
0.03 |
0.05 |
0.40 |
0.5270 |
|
Asian/American Indian/Alaska Native/Other/multiple races |
0.24 |
0.06 |
18.00 |
<.0001 |
|
Age (years) (ref = 18-39) |
|
|||
|
40-64 |
0.13 |
0.03 |
13.85 |
0.0002 |
|
65+ |
-0.07 |
0.05 |
2.43 |
0.1190 |
|
Sex (ref=female) |
|
|||
|
Male |
-0.16 |
0.03 |
39.80 |
<.0001 |
|
BMI: (ref=underweight/normal weight (BMI<25)) |
|
|||
|
Overweight (25 ≤ BMI < 30) |
0.15 |
0.03 |
18.42 |
<.0001 |
|
Obese I (30 ≤ BMI < 35) |
0.19 |
0.04 |
25.38 |
<.0001 |
|
Obese II (35 ≤ BMI < 40) |
0.20 |
0.05 |
19.11 |
<.0001 |
|
Obese III (BMI ≥ 40) |
0.13 |
0.05 |
6.57 |
0.0104 |
|
Elevated lipids (ref=no) |
0.22 |
0.03 |
49.02 |
<.0001 |
|
Hypertension (ref=no) |
0.34 |
0.03 |
158.26 |
<.0001 |
|
History of tobacco use (ref=no) |
-0.06 |
0.03 |
5.19 |
0.0228 |
|
HbA1c level (ref=5.7 to <6.0%) |
|
|||
|
6.0 to <6.3% |
0.51 |
0.03 |
338.06 |
<.0001 |
|
6.3 to <6.5% |
0.48 |
0.05 |
100.87 |
<.0001 |
|
Number of encounters prior to prediabetes+ |
-0.06 |
0.01 |
90.71 |
<.0001 |
|
Region (ref = South) |
|
|||
|
Northeast |
1.49 |
0.05 |
851.33 |
<.0001 |
|
Rocky |
1.10 |
0.04 |
916.16 |
<.0001 |
|
West |
1.26 |
0.04 |
896.63 |
<.0001 |
Multivariable logistic regression model with diagnosis of prediabetes as outcome. Estimates, standard error (SE), Wald chi- square and p-values are presented; +every 10 encounters
HbA1c level was the most significant clinical factor that increased the likelihood of a prediabetes diagnosis. Compared to patients with a low HbA1c level, those with medium and high levels had ORs of 1.68 (CI 1.54-1.78) and 1.61 (CI 1.43-1.83), respectively, for receiving a diagnosis. Other clinical factors that increased the likelihood of a prediabetes diagnosis included hypertension (OR 1.40, CI 1.31-1.51), elevated lipids (OR 1.24, CI 1.15-1.39), and weight category (OR ranged from 1.16 to 1.22 for those overweight thru obese II when compared to normal/underweight patients).
Compared to non-Hispanic white patients, Hispanic and Asian/American Indian/Alaskan Native/Other/Multiracial patients were more likely to be diagnosed with prediabetes (ORs of 1.29, CI 1.18-1.42 and 1.27 CI 1.10-1.48, respectively). Patients in the 40-64 age group were more likely to be diagnosed than the 18-39 age group (OR 1.14, CI 1.04-1.27). Males were less likely than females to have a prediabetes diagnosis (OR 0.85, CI 0.80-0.91). Region and number of encounters were also significant factors in estimating odds of being diagnosed.
Longitudinal analyses for risk of type 2 diabetes
Figure 3 presents the hazard ratios from the adjusted Cox regression model at median time for a prediabetes diagnosis. Supplemental Table 4 presents the adjusted parameter estimates, standard errors, and p-values from the adjusted Cox regression model.
The patient’s HbA1c level was the most significant predictor of type 2 diabetes with chi-square values 5 to 10 times higher than for any other predictor (Supplemental Table 4). The effect of receiving a prediabetes diagnosis varied by HbA1c level (p<.0001 for interaction term). For each HbA1c level, UDxP patients progress to type 2 diabetes faster than DxP patients, and the difference in progression increases with higher baseline HbA1c levels. Specifically, as compared to UDxP patients by HbA1c level, DxP patients within the low, medium, and high HbA1c levels, the HRs were 0.83 (CI 0.67-1.02), 0.65 (CI 0.21-0.78), and 0.47 (0.36-0.61) at median time, respectively (Figure 2).
Figure 4a presents a Kaplan-Meier survival plot generated from the adjusted Cox regression model. The figure shows the survival curve for each HbA1c level and diagnosis status. In all three classifications of HbA1c level, patients in the UDxP population progress to type 2 diabetes at a faster rate. The survival rate at the end of follow-up for those at the low HbA1c level were ~95% for DxP and ~94% for UDxP (~1% difference). Among patients with a medium HbA1c level, the survival rate was approximately 87% for those diagnosed and 82% for those undiagnosed (~5% difference). Likewise, the survival rates for the high HbA1c level were 75% for those diagnosed and 55% for those undiagnosed (~20% difference). This pattern was consistently found across the various combinations of Kaplan-Meier plots assessed.
Figure 4b presents the adjusted hazard ratios for DxP versus UDxP patients over time by HbA1c level. The figure shows that the protective effect of a prediabetes diagnosis wanes more slowly in the high HbA1c level group compared to the low HbA1c group (1820 versus 829 days). Furthermore, the higher the HbA1c level, the flatter the HR slope: the highest HR reached among the high HbA1c level group was nearly 1.5 by the end of the study period that was plotted (~7 years), while the low HbA1c level group reached an HR above 2.5 over the same time interval.
Other characteristics had significant relationships with development of type 2 diabetes. Among clinical factors, patients in obesity I, II, and III categories were more likely to develop type 2 diabetes than those in the normal/underweight classification (HRs ranged from 1.3-1.7). Other positive associations with development of type 2 diabetes were found for those with elevated lipids (HR 1.89, CI 1.67-2.15) and hypertension (HR 1.12, CI 1.03-1.22).
Among demographic factors, risk of development of type 2 diabetes was greater for males compared to females (HR 1.18, CI 1.08-1.28), Asian/American Indian/Alaska Native/ Other/Multiracial patients compared to non-Hispanic white patients (HR 1.35, CI 1.31-1.62), and increasing number of encounters (HR 1.13, CI 1.11-1.15). Compared to patients in the 18-39 age group, patients in the 40-64, and 65+ age groups had HRs of 0.85 (CI 0.75-0.95) and 0.76 (CI 0.66-0.88), respectively.
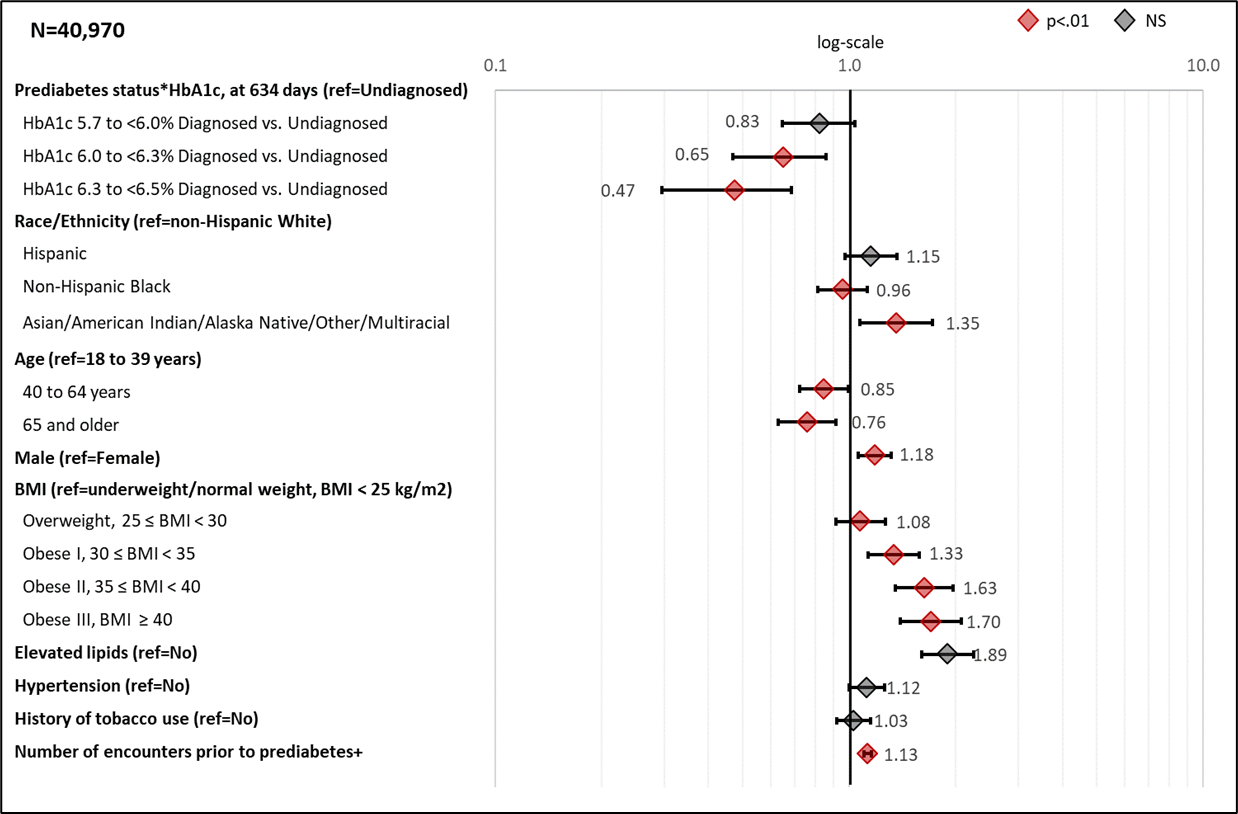
Figure 3: Adjusted hazard ratios (99% CI) Associated with Selected Characteristics for Recording a Diagnosis of Type 2 Diabetes
Forest plots showing the hazard ratios for progression to type 2 diabetes from right-censored cox-non-proportional hazard model. +Number of encounters reflect 10 unit increase. Hazard ratios reflect median follow-up time of 634 days and interaction term between prediabetes diagnosis and log time. In addition to variables presented in forest plot, the model also adjusted for LEADR region
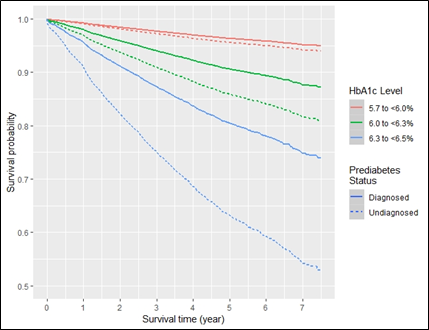
Figure 4a: Survival probability curves for onset of type 2 diabetes by prediabetes diagnosis status and HbA1c level at median follow-up time.
Adjusted curve presented are for females, aged 40-64 at a normal/underweight body mass index, with neither elevated lipids, hypertension, metformin prescription, nor history of tobacco use, in LEADR’s south region; mean number of encounters is 24.3, and median follow-up time is 634 days
Table S4: Adjusted Cox non-proportional hazards analysis for assessing type 2 diabetes status
|
Parameter |
Estimate |
SE |
Chi-Square |
p-value |
|
Prediabetes status |
-4.768 |
0.435 |
119.70 |
<.0001 |
|
HbA1c level (ref=low HbA1c) |
|
|
|
|
|
Medium HbA1c |
1.216 |
0.054 |
508.43 |
<.0001 |
|
High HbA1c |
2.321 |
0.060 |
1492.13 |
<.0001 |
|
Prediabetes status*HbA1c (ref=undiagnosed*low HbA1c) |
|
|
|
|
|
Diagnosed*Medium HbA1c |
-0.243 |
0.107 |
5.15 |
0.0233 |
|
Diagnosed*High HbA1c |
-0.056 |
0.128 |
19.12 |
<.0001 |
|
Prediabetes status*LogTime |
0.709 |
0.065 |
118.16 |
<.0001 |
|
Race/Ethnicity (ref=non-Hispanic white) |
|
|||
|
Hispanic |
0.140 |
0.07 |
4.61 |
0.0318 |
|
Non-Hispanic black |
-0.044 |
0.06 |
0.50 |
0.4809 |
|
Asian/American Indian/Alaska Native/Other/multiple races |
0.303 |
0.09 |
10.96 |
0.0009 |
|
Age (years) (ref = 18-39) |
|
|||
|
40-64 |
-0.166 |
0.06 |
7.46 |
0.0063 |
|
65+ |
-0.275 |
0.07 |
13.89 |
0.0002 |
|
Sex (ref=female) |
|
|||
|
Male |
0.165 |
0.04 |
16.29 |
<.0001 |
|
BMI: (ref=underweight/normal weight (BMI<25)) |
|
|||
|
Overweight (25 ≤ BMI < 30) |
0.073 |
0.06 |
1.37 |
0.2414 |
|
Obese I (30 ≤ BMI < 35) |
0.289 |
0.06 |
20.03 |
<.0001 |
|
Obese II (35 ≤ BMI < 40) |
0.486 |
0.07 |
44.74 |
<.0001 |
|
Obese III (BMI ≥ 40) |
0.529 |
0.08 |
47.41 |
<.0001 |
|
Elevated lipids (ref = no) |
0.639 |
0.07 |
95.41 |
<.0001 |
|
Hypertension (ref=no) |
0.114 |
0.04 |
6.38 |
0.0115 |
|
History of tobacco use (ref =no) |
0.029 |
0.04 |
0.46 |
0.4983 |
|
Metformin prescription (ref=no) |
-13.229 |
65.63 |
0.04 |
0.8402 |
|
Number of encounters after prediabetes+ |
0.120 |
0.01 |
197.24 |
<.0001 |
|
Region (ref = South) |
|
|||
|
Northeast |
-0.944 |
0.09 |
108.89 |
<.0001 |
|
Rocky |
-0.892 |
0.06 |
221.10 |
<.0001 |
|
West |
-0.71 |
0.07 |
112.41 |
<.0001 |
Right-censored Cox non-proportional hazards model with onset of diabetes as outcome. Estimates, standard errors (SE), chi-square and p-values presented. +every 10 encounters, centered around mean.
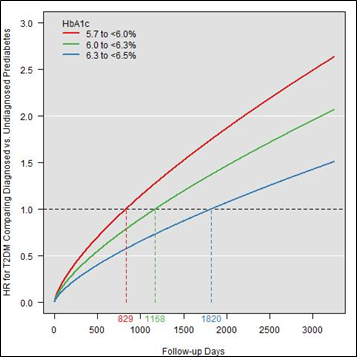
Figure 4b: Adjusted hazard ratios for onset of type 2 diabetes comparing Diagnosed to Undiagnosed Prediabetes Patients over follow-up in Days by HbA1c level.
Conclusions
This study aimed to determine demographic and clinical differences between patients with and without a prediabetes diagnosis among incident prediabetes cases detected by HbA1c, as well as differences in rates of development of type 2 diabetes. Results show that greater BMI, higher HbA1c, elevated lipids, hypertension, and frequency of encounters are clinical factors associated with assigning a prediabetes diagnosis. Demographic factors associated with a diagnosis included being female, Hispanic or Asian/American Indian/Alaska Native/Other/Multiracial, and being in the 40-64 age group. Results further indicate that assigning a prediabetes diagnosis is associated with slower development of diabetes, and the protective benefit of a diagnosis increases the higher a patient’s baseline HbA1c level. Overall, higher HbA1c levels were associated with greater rates of diabetes onset, as was being younger, male, obese, and Asian/American Indian/Alaska Native/Other/Multiracial, and having elevated lipids, hypertension, and more encounters within the health care system.
This study leverages EHR data to investigate the demographic and clinical differences between undiagnosed and diagnosed prediabetes patients. Most prediabetes patients in this analysis were classified as undiagnosed, which is consistent with previous research23,24,25. Previous studies have found that EHRs are useful tools for identifying at-risk patients for prediabetes screening14,15,26,27, and this study adds insight into patient-level characteristics that may influence diagnosis. Findings from this study also highlight the potential value of assigning a prediabetes diagnosis to patients with evidence of the condition through an HbA1c test, and adds to the research for using HbA1c as a metric for assessing and treating prediabetes19,28,29,30. Having a prediabetes diagnosis may lead to patient-provider conversations about diabetes risks, resulting in patient changes in risk reduction behaviors31,32,33. The finding that the diagnosed group had nearly 8 more encounters than the undiagnosed group following the baseline prediabetes date may be an indication of patient activation following the prediabetes diagnosis.
Demographic differences in the assignment of a prediabetes diagnosis may reflect broad health equity and contextual factors34,35,36. There are many provider specific and system-level contextual factors that may influence clinical practice, including support and uptake of the recommended practice guidelines within each health system37. Decisions to assign a prediabetes diagnosis can also be affected by varying organizational protocols, availability of resources to address prediabetes, programming targeted to at-risk populations, and differing levels of provider awareness of diabetes prevention programs, resulting in differences in how clinicians assign diagnosis codes38-42. Variability in the strength of provider beliefs in prediabetes as a disease entity may also influence a decision to assign or not assign this diagnosis19,28,43,44. The high number of undiagnosed patients in our study could also be reflective of a lack of action to assign a medical condition based solely on a lab result in the prediabetes range. This could particularly be true among patients with a low HbA1c level as they made up 71% of the undiagnosed prediabetes group compared to 59.6% of the diagnosed group.
There are inherent limitations in observational studies and those utilizing EHR data, including that EHR data provide more information on patients engaged more frequently with health systems. Limitations in our analysis were minimized to the best of our ability. For example, large administrative datasets may lack precision and detail, and require a validated methodology for identifying patients with chronic diseases like diabetes45. We addressed this concern by applying rigorous standards to separate those with and without a prediabetes diagnosis code. While there is currently widespread interest in promoting and adopting EHRs as a viable research tool for prevention, low data density for various observations and discrepancies in regional data availability is challenging. We conducted a complete-case analysis under the assumption that each of the covariates in our analysis were observations available to providers when assessing patients’ risk for prediabetes. However, we recognize that our analysis was biased towards patients with all these variables available in the EHR and acknowledge this is not fully representative of real-world scenarios.
Solely defining patients based on HbA1c may have overlooked a number of patients who had normal HbA1c observations with corresponding blood glucoses in the prediabetes range. However, given that most of the patients within LEADR did not have a fasting indicator (over 95%), we focused on HbA1c to serve as a reliable criterion for assessing prediabetes. Furthermore, while applying a 365-day “washout” period has been used in previous studies to account for the prevalence of a condition, we recognize that this process does not fully guarantee all patients in our analytic population had incident prediabetes46,47,48.
Other limitations include lack of information on diet, physical activity, or socioeconomic status. To preserve confidentiality of participating healthcare organizations, provider- and clinic-level characteristics were not available to the LEADR research team, including information on clinic type or physician specialty - all potentially important factors in screening and treating prediabetes and diabetes.
Future research should continue examining prediabetes diagnosis patterns among providers and the potential short- and long-term health impacts of a prediabetes diagnosis on patients. Based on the demographic differences in diagnosis rates found in this study, we recommend further exploration of health equity factors of a patient, including social determinants, which may influence assignment of a prediabetes diagnosis. A focus on provider characteristics would also further help researchers gain a more robust understanding of the nonclinical characteristics influencing the assigning of a prediabetes diagnosis. This study also recommends further research on the mitigating factors on the progression to diabetes among patients with prediabetes, including referrals to and uptake of lifestyle intervention counseling.
Acknowledgements
This project was solely funded by the Centers for Disease Control and Prevention under contract HHSD200201587699 to Westat Inc. The findings and conclusions in this report are those of the authors and do not necessarily represent the official position of the Centers for Disease Control and Prevention or the National Institutes of Health. The article contents have not been presented elsewhere. The authors declare that they have no conflict of interest. No financial disclosures were reported by the authors of this paper.
Study concept, data collection, analysis, and manuscript preparation and review completed by Maurice Johnson, MPH, Howard A. Fishbein, DrPH, Rebecca Birch, MPH, and Qilu Yu, PhD. Study concept, data collection and analysis completed by Russ Mardon, PhD and Wilson Pace, MD. Study concept, analysis input and manuscript review provided Chet Fox, MD1, Kari Stephens, PhD2, Bethany Kwan, PhD, MSPH3.
1Greater Buffalo United Accountable Healthcare Network
2University of Washington
3University of Colorado
Conflict of Interest
All authors approved the manuscript before submission and declared no financial disclosures or conflicts of interest.
References
- Centers for Disease Control and Prevention. National Diabetes Statistics Report, 2017. Atlanta, GA: Centers for Disease Control and Prevention, US Department of Health and Human Services.
- American Diabetes Association. Statistics about Diabetes, 2018. Available from: http://www.diabetes.org/diabetes-basics/statistics/
- American Diabetes Association. Economic Costs of Diabetes in the U.S. in 2017. Diabetes Care 2018; 41(5): 917-928. https://doi.org/10.2337/dci18-0007
- Tabák AG, Herder C, Rathmann W, et al. Prediabetes: a high-risk state for diabetes development. Lancet. 2012; 379(9833): 2279-90. https://doi.org/10.1016/S0140-6736(12)60283-9
- Garber AJ, Abrahamson MJ, Barzilay JI, et al. Consensus statement by the American Association of Clinical Endocrinologists and American College of Endocrinology on the comprehensive type 2 diabetes management algorithm–2018 executive summary. Endocr Pract. 2018; 24(1): 91-120.
- Edwards CM, Cusi K. Prediabetes: a worldwide epidemic. Endocrinol Metab Clin. 2016; 45(4): 751-764.
- Gong Q, Zhang P, Wang J, et al. Morbidity and mortality after lifestyle intervention for people with impaired glucose tolerance: 30-year results of the Da Qing Diabetes Prevention Outcome Study. Lancet Diabetes Endocrinol. 2019; 7(6): 452-461.
- Diabetes Prevention Program Research Group. 10-year follow-up of diabetes incidence and weight loss in the Diabetes Prevention Program Outcomes Study. Lancet. 2009; 374(9702): 1677-1686.
- American Diabetes Association. 3. Prevention or delay of type 2 diabetes: Standards of Medical Care in Diabetes—2019. Diabetes Care. 2019; 42(Supplement 1): S29-S33.
- Nhim K, Khan T, Gruss SM, et al. Primary Care Providers' Prediabetes Screening, Testing, and Referral Behaviors. Am J Prev Med. 2018; 55(2): e39-e47.
- Moin T, Schmittdiel JA, Flory JH, et al. Review of metformin use for type 2 diabetes prevention. American journal of preventive medicine. 2018; 55(4): 565-574.
- Marshall C, Adams S, Dyer W, et al. Opportunities to Reduce Diabetes Risk in Women of Reproductive Age: Assessment and Treatment of Prediabetes within a Large Integrated Delivery System. Women’s Health Issues. 2017; 27(6): 666–672. https://doi.org/10.1016/j.whi.2017.06.001
- Schmittdiel JA, Adams SR, Segal J, et al. Novel use and utility of integrated electronic health records to assess rates of prediabetes recognition and treatment: brief report from an integrated electronic health records pilot study. Diabetes Care. 2014; 37(2): 565–568. https://doi.org/10.2337/dc13-1223
- Zimmermann LJ, Thompson JA, Persell SD. Electronic health record identification of prediabetes and an assessment of unmet counselling needs. J Eval Clin Pract. 2012; 18(4): 861–865. https://doi.org/10.1111/j.1365-2753.2011.01703.x
- Keck JW, Thomas AR, Hieronymus L, et al. Prediabetes Knowledge, Attitudes, and Practices at an Academic Family Medicine Practice. J Am Board Fam Med. 2019; 32(4): 505-512. DOI: https://doi.org/10.3122/jabfm.2019.04.180375
- Barry E, Roberts S, Oke J, et al. Efficacy and effectiveness of screen and treat policies in prevention of type 2 diabetes: systematic review and meta-analysis of screening tests and interventions. BMJ. 2017; 356: i6538. doi: 10.1136/bmj.i6538
- Yudkin JS, Montori VM. The epidemic of pre-diabetes: the medicine and the politics. BMJ. 2014; 349: g4485. doi: 10.1136/bmj.g4485
- Piller C. Dubious diagnosis. Science 2019; 363(6431): 1026-1031. DOI: 10.1126/science.363.6431.1026
- Zhang X, Gregg EW, Williamson DF, et al. A1C level and future risk of diabetes: a systematic review. Diabetes Care. 2010; 33(7): 1665-73. doi: 10.2337/dc09-1939
- Morris DH, Khunti K, Achana F, et al. Progression rates from HbA1c 6.0-6.4% and other prediabetes definitions to type 2 diabetes: a meta-analysis. Diabetologia. 2013; 56(7): 1489-1493. doi: 10.1007/s00125-013-2902-4
- Fishbein HA, Birch RJ, Mathew SM, et al. The Longitudinal Epidemiologic Assessment of Diabetes Risk (LEADR): Unique 1.4 M patient Electronic Health Record Cohort. Healthc (Amst). 2020; 8(4): 100458. doi: 10.1016/j.hjdsi.2020.100458
- Observational Health Data Sciences and Informatics (OHDSI). OMOP Common Data Model 2017.
- Mainous AG, Tanner RJ, Scuderi CB, et al. Prediabetes Screening and Treatment in Diabetes Prevention: The Impact of Physician Attitudes. J Am Board Fam Med. 2016; 29(6): 663-671. doi: 10.3122/jabfm.2016.06.160138
- Charfen MA, Ipp E, Kaji AH, et al. Detection of undiagnosed diabetes and prediabetic states in highârisk emergency department patients. Acad Emerg Med. 2009; 16(5): 394-402.
- Mardon R, Marker D, Nooney J, et al. Peer Reviewed: Novel Methods and Data Sources for Surveillance of State-Level Diabetes and Prediabetes Prevalence. Prev Chronic Dis. 2017; 14: E106.
- Sohler N, Matti-Orozco B, Young E, et al. Opportunistic screening for diabetes and prediabetes using hemoglobin a1c in an urban primary care setting. Endocr Pract. 2016; 22(2), 143-150. https://doi.org/10.4158/EP15866.OR
- Holliday CS, Williams J, Salcedo V, et al. Peer Reviewed: Clinical Identification and Referral of Adults With Prediabetes to a Diabetes Prevention Program. Preventing chronic disease. 2019; 16: E82.
- Cohen RM, Haggerty S, Herman WH. HbA1c for the diagnosis of diabetes and prediabetes: is it time for a mid-course correction? J Clin Endocrinol Metab. 2010; 95(12): 5203-5206.
- Tankova T, Chakarova N, Dakovska L, et al. Assessment of HbA1c as a diagnostic tool in diabetes and prediabetes. Acta Diabetol. 2012: 49(5): 371-378.
- Evron JM, Herman WH, McEwen LN. Changes in screening practices for prediabetes and diabetes since the recommendation for hemoglobin A1c testing. Diabetes care. 2019; 42(4): 576-584.
- Geiss LS, James C, Gregg EW, et al. Diabetes risk reduction behaviors among US adults with prediabetes. Am J Prev Med. 2010; 38(4): 403-9.
- Okosun IS, Lyn R. Prediabetes awareness, healthcare provider’s advice, and lifestyle changes in American adults. International Journal of Diabetes Mellitus. 2015; 3(1): 11-18.
- Murillo R, Katic BJ, Gonzalez T, et al. The Association of Prediabetes and Diabetes Risk Perception With Leisure-Time Physical Activity and Weight Loss. Am J Health Promot. 2019; 33(4): 534-540.
- Campbell TJ, Alberga A, Rosella LC. The impact of access to health services on prediabetes awareness: A population-based study. Preventive medicine. 2016; 93: 7-13.
- Okosun IS, Seale JP, Lyn R, et al. Improving detection of prediabetes in children and adults: Using combinations of blood glucose tests. Frontiers in public health. 2015; 3: 260.
- Hooks-Anderson DR, Crannage EF, Salas J, et al. Race and referral to diabetes education in primary care patients with prediabetes and diabetes. The Diabetes Educator. 2015; 41(3): 281-289.
- DeJesus RS, Breitkopf CR, Rutten LJ, et al. Incidence Rate of Prediabetes Progression to Diabetes: Modeling an Optimum Target Group for Intervention. Popul Health Manag. 2017; 20(3): 216-223.
- Hollander P, Spellman C. Controversies in prediabetes: do we have a diagnosis? Postgrad Med. 2012; 124(4): 109-118. https://doi.org/10.3810/pgm.2012.07.2562
- Nhim K, Khan T, Gruss SM, et al. Primary Care Providers’ Prediabetes Screening, Testing, and Referral Behaviors. Am J Prev Med. 2018; 55(2): e39-e47. doi: 10.1016/j.amepre.2018.04.017
- Moin T, Li J, Duru OK, et al. Metformin prescription for insured adults with prediabetes from 2010 to 2012: a retrospective cohort study. Ann Intern Med. 2015; 162(8): 542-8. doi: 10.7326/M14-1773
- Anderson ZL, Scopelliti EM, Trompeter JM, et al. Management of prediabetes: a comparison of the treatment approaches utilized by a family practice clinic and an internal medicine/endocrinology practice. J Pharm Pract. 2015; 28(1): 86-92. doi: 10.1177/0897190013514089
- Tseng E, Greer RC, O’Rourke P, et al. Survey of primary care providers’ knowledge of screening for, diagnosing and managing prediabetes. Journal of general internal medicine. 2017; 32(11): 1172-1178.
- Mainous AG, Tanner RJ, Scuderi CB, et al. Prediabetes Screening and Treatment in Diabetes Prevention: The Impact of Physician Attitudes. J Am Board Fam Med. 2016; 29(6): 663-671. doi: 10.3122/jabfm.2016.06.160138
- Greer RC, O’Rourke P, Yeh HC, et al. Survey of primary care providers’ knowledge of screening for, diagnosing and managing prediabetes. J Gen Intern Med. 2017; 32(11): 1172–1178. https://doi.org/10.1007/s11606-017-4103-1
- Harris SB, Glazier RH, Tompkins JW, et al. Investigating concordance in diabetes diagnosis between primary care charts (electronic medical records) and health administrative data: a retrospective cohort study. BMC Health Serv Res. 2010; 10(1): 347. https://doi.org/10.1186/1472-6963-10-347
- Nichols GA, Desai J, Elston Lafata J, et al. Construction of a multisite DataLink using electronic health records for the identification, surveillance, prevention, and management of diabetes mellitus: the SUPREME-DM project. Preventing chronic disease. 2012; 9: E110.
- Chung S, Zhao B, Lauderdale D, et al. Initiation of treatment for incident diabetes: evidence from the electronic health records in an ambulatory care setting. Primary care diabetes. 2015; 9(1): 23-30.
- Eastwood SV, Mathur R, Atkinson M, et al. Algorithms for the capture and adjudication of prevalent and incident diabetes in UK Biobank. PloS one. 2016; 11(9): e0162388.